


Your biggest sale of the season is starting, your engineers have deployed big changes to support the traffic, and you’ve got your fingers crossed.
Six hours later, you realize that almost no purchases have been made. Looking at the trends, you find that a large number of bugs were raised because almost none of the users could add products to their cart.
All of this occurred because of a small bug, but it went unnoticed and led to a loss of thousands of dollars in revenue.
Anomaly detection could help you avoid this situation, alerting your team when there’s a significant deviation from the expected trend so they can take appropriate action to resolve the situation.
An anomaly is a sudden, unexpected deviation from the normal.
Why should you care?
Low probability events are not zero probability events.
Things that have never happened before happen all the time.
– Morgan Housel
Identifying anomalies and acting upon them is an important process for any business, especially when one has thousands of users interacting with their systems. Detecting an anomaly is the first step to finding and more importantly, solving a bigger problem with your system.
Anomaly detection can help you uncover:
- Bot attacks
- Malicious activity or fraud
- Security issues
- Bugs
And much more!
In this blog, we’ll look into the basics of time series data, various types of anomalies in time series data, and an overview of some preferred techniques to detect anomalies.
In the next blog, we’ll dive deeper into the techniques.
Some basics of Time Series Data:
Time series data is a sequence of data points collected over regular time intervals.
It can be as simple as a quarterly financial report or as complex as millisecond-accurate autonomous-car-sensor data. In fact, nearly all the data you interact with is time series data.
This type of data is highly valuable as it allows us to see trends over time, forecast future changes, and detect anomalies.
Components of Time Series Data:
The value of time series data is affected by 4 components:
- Trend
- Seasonality
- Cyclicity
- Random/ Irregular movements
Trend
A trend is a long-term tendency of the data to move in a specific direction. This can be linear or nonlinear.
For example: The global population, which has been increasing steadily over the past decades.

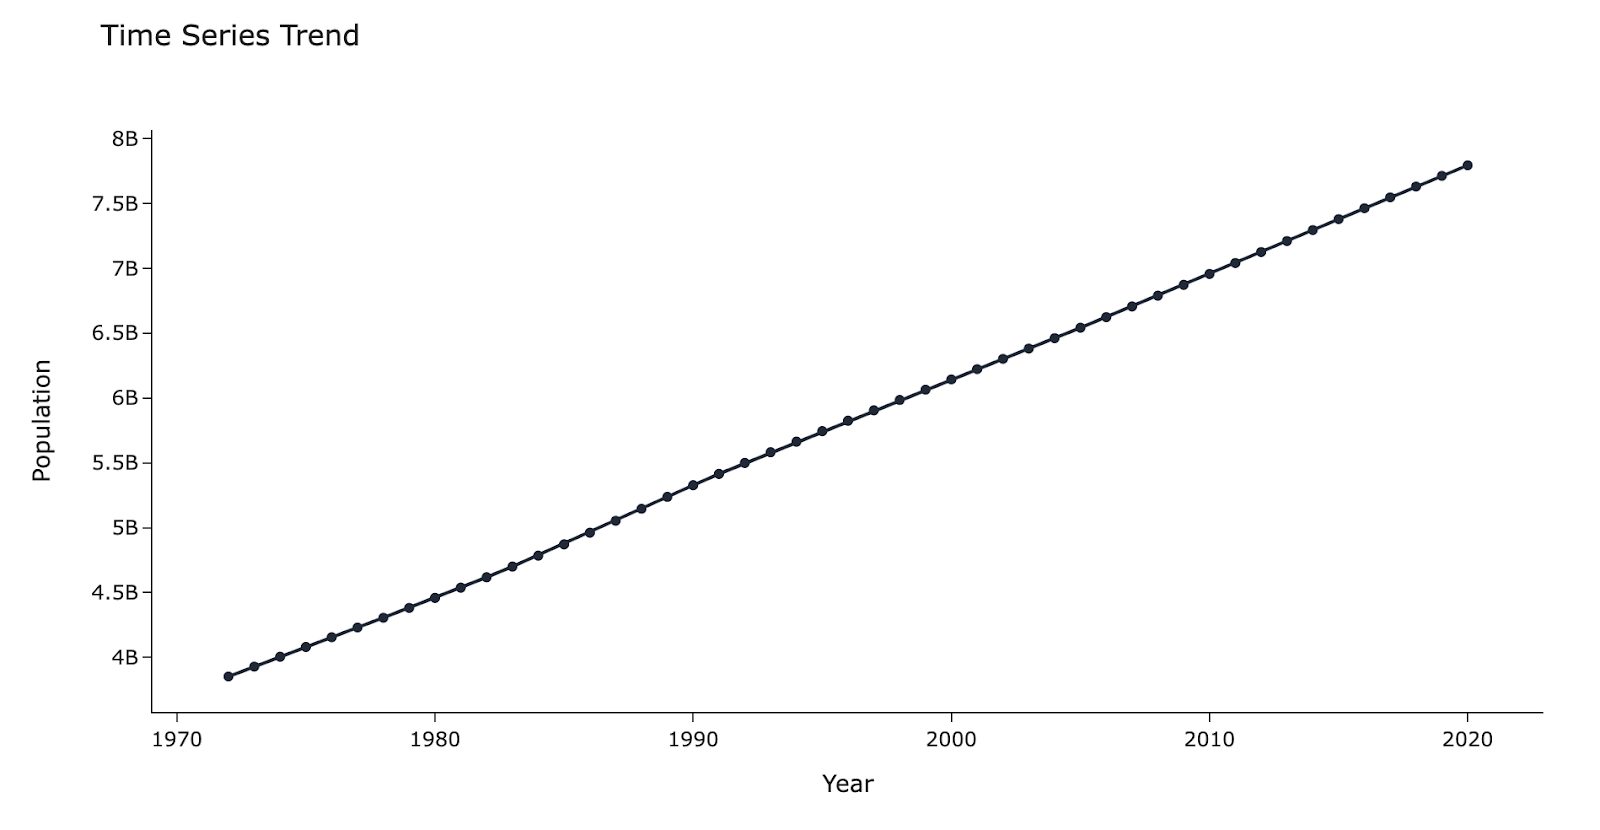
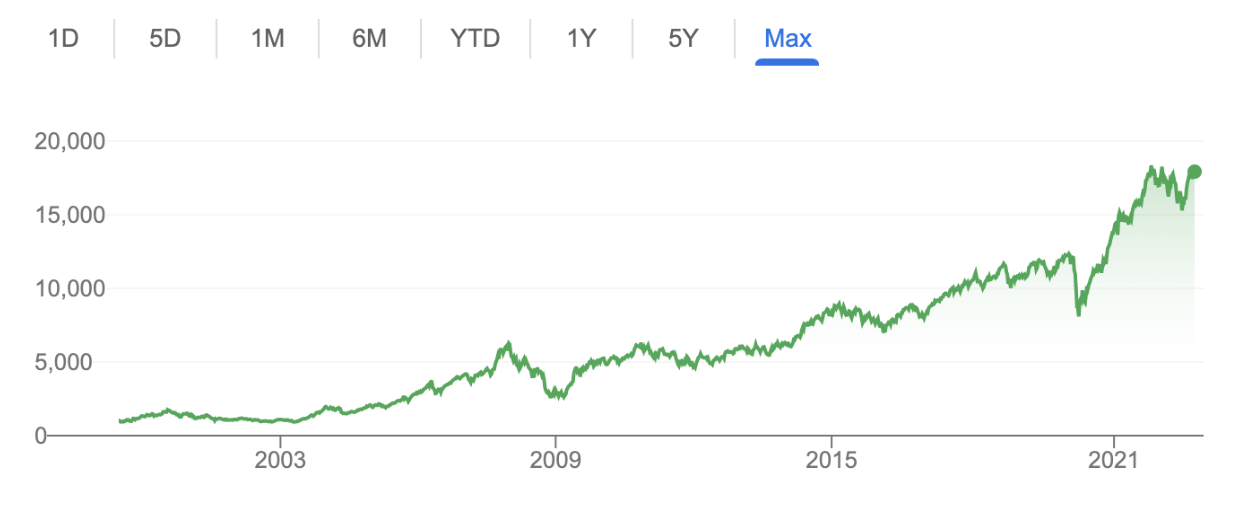
A trend does not have to move in the same direction at all times. It can change directions and even flatline, but the overall tendency over a long enough period of time should be to maintain the same direction.
The Indian stock market index has an increasing trend over the past two decades, despite many drops.

Seasonality
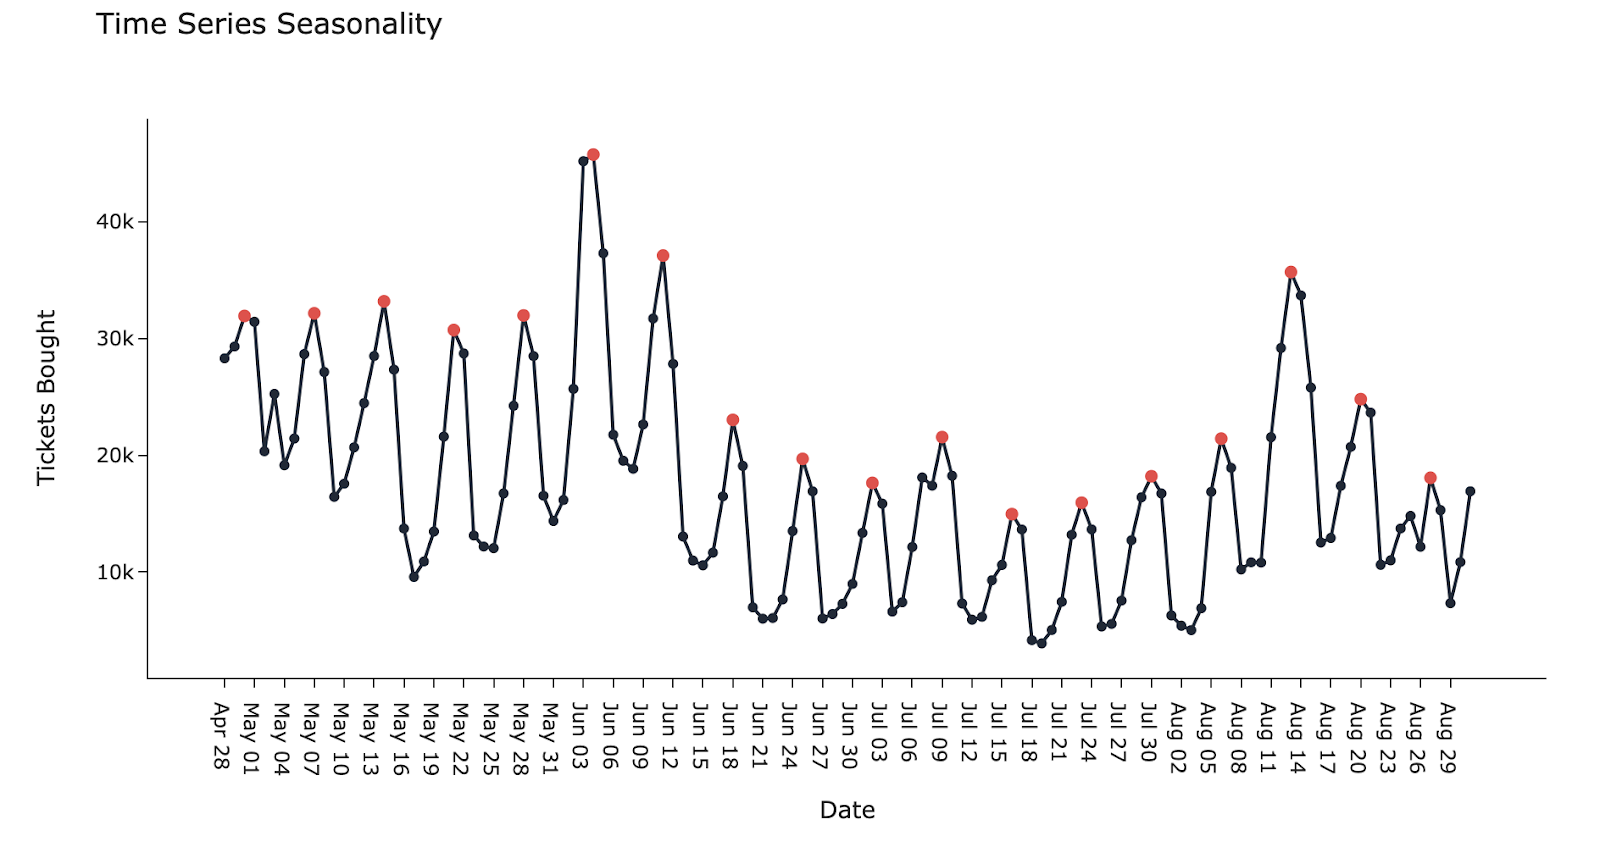
Seasonality is simply a repeating pattern in time-series data that occurs at regular intervals.
An example of seasonality:
The graph below shows the number of tickets bought through an entertainment ticket booking app. The red markers are Saturdays, showing that there is a weekly seasonality of a high number of tickets sold as the weekend starts.

Another example with seasonality: an upward trend with a few anomalies:


Cyclicity
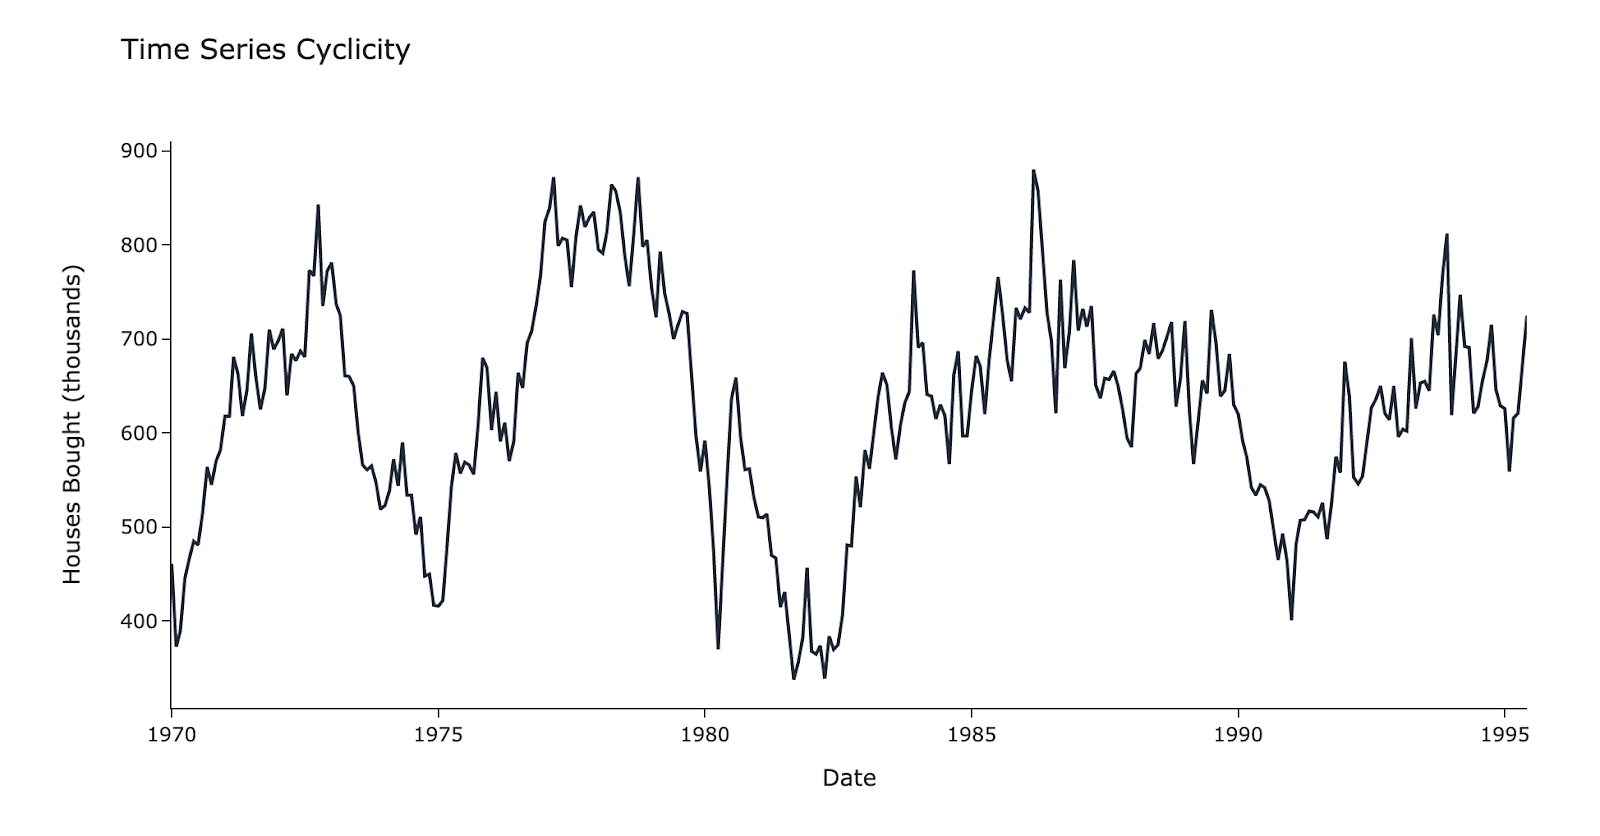
When time series data exhibits rises and falls that are not of a fixed period, this is known as cyclicity. Cyclicity is different from seasonality because here, the time interval between rises and falls is not known or fixed.
Below is a graph showing houses bought in a country over a long period of time. There’s cyclicity in the data as there are peaks and troughs, but they do not have a regular, predictable interval between them.

Irregular Movements:
These are unpredictable changes in time series data with no identifiable pattern.
Earthquakes, wars, floods, and recessions are some examples of irregular patterns in time series data. Often, these irregular movements are marked as anomalies by anomaly detection algorithms.
All the above components, when isolated, can help in finding anomalies. Some algorithms that do so are SH-ESD and STL (We will explore these soon).
Let’s look at how we can detect anomalies in time series data:
Types of time series anomalies:
Point anomaly

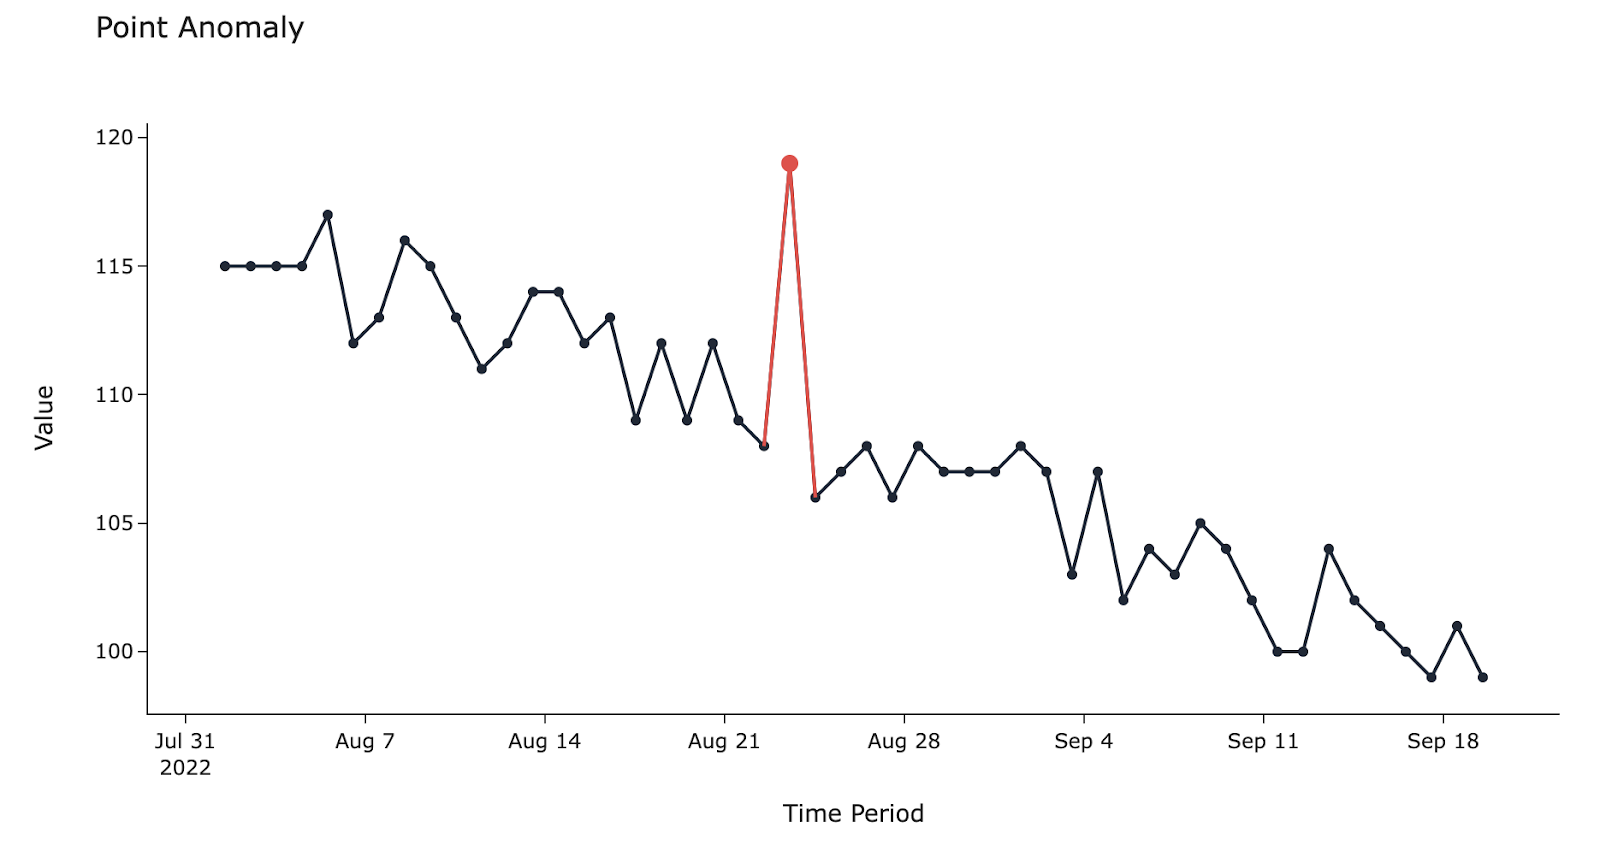
A single, sudden spike or drop in a value
For example, a sudden jump in rainfall measured over 24 hours
Collective anomaly

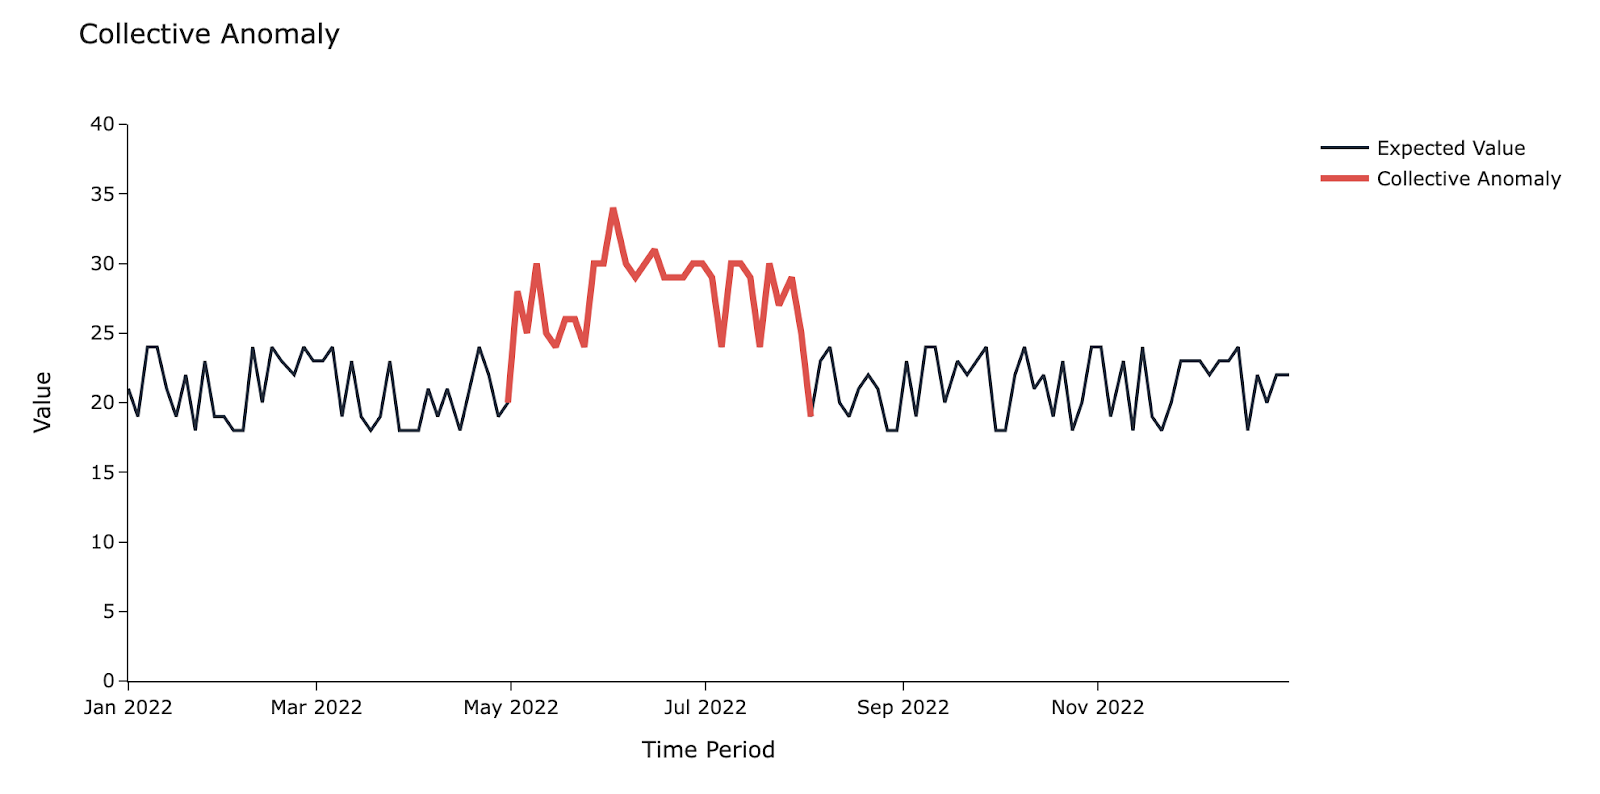
A collective anomaly is a sustained change from the rest of the trend. This could also be a group of point anomalies.
For example, increased power consumption in your home during the summer months.
Contextual anomaly
Having a heart rate of 150 BPM may be normal when a person is exercising, but the same BPM at 4AM is worrying. This is a contextual anomaly, the context being that people are usually asleep at 4AM.
Detecting anomalies:
A good anomaly detection algorithm takes into account the various components of time series data. Each technique has its pros and cons, and each can detect one or more of the types of anomalies mentioned above.
An overview of various algorithms to detect anomalies in time series data:
- ARIMA
- Abbreviation of Auto Regressive Integrated Moving Average
- Usually used for forecasting; can be used to find anomalies by using the difference between forecasted values and actual values
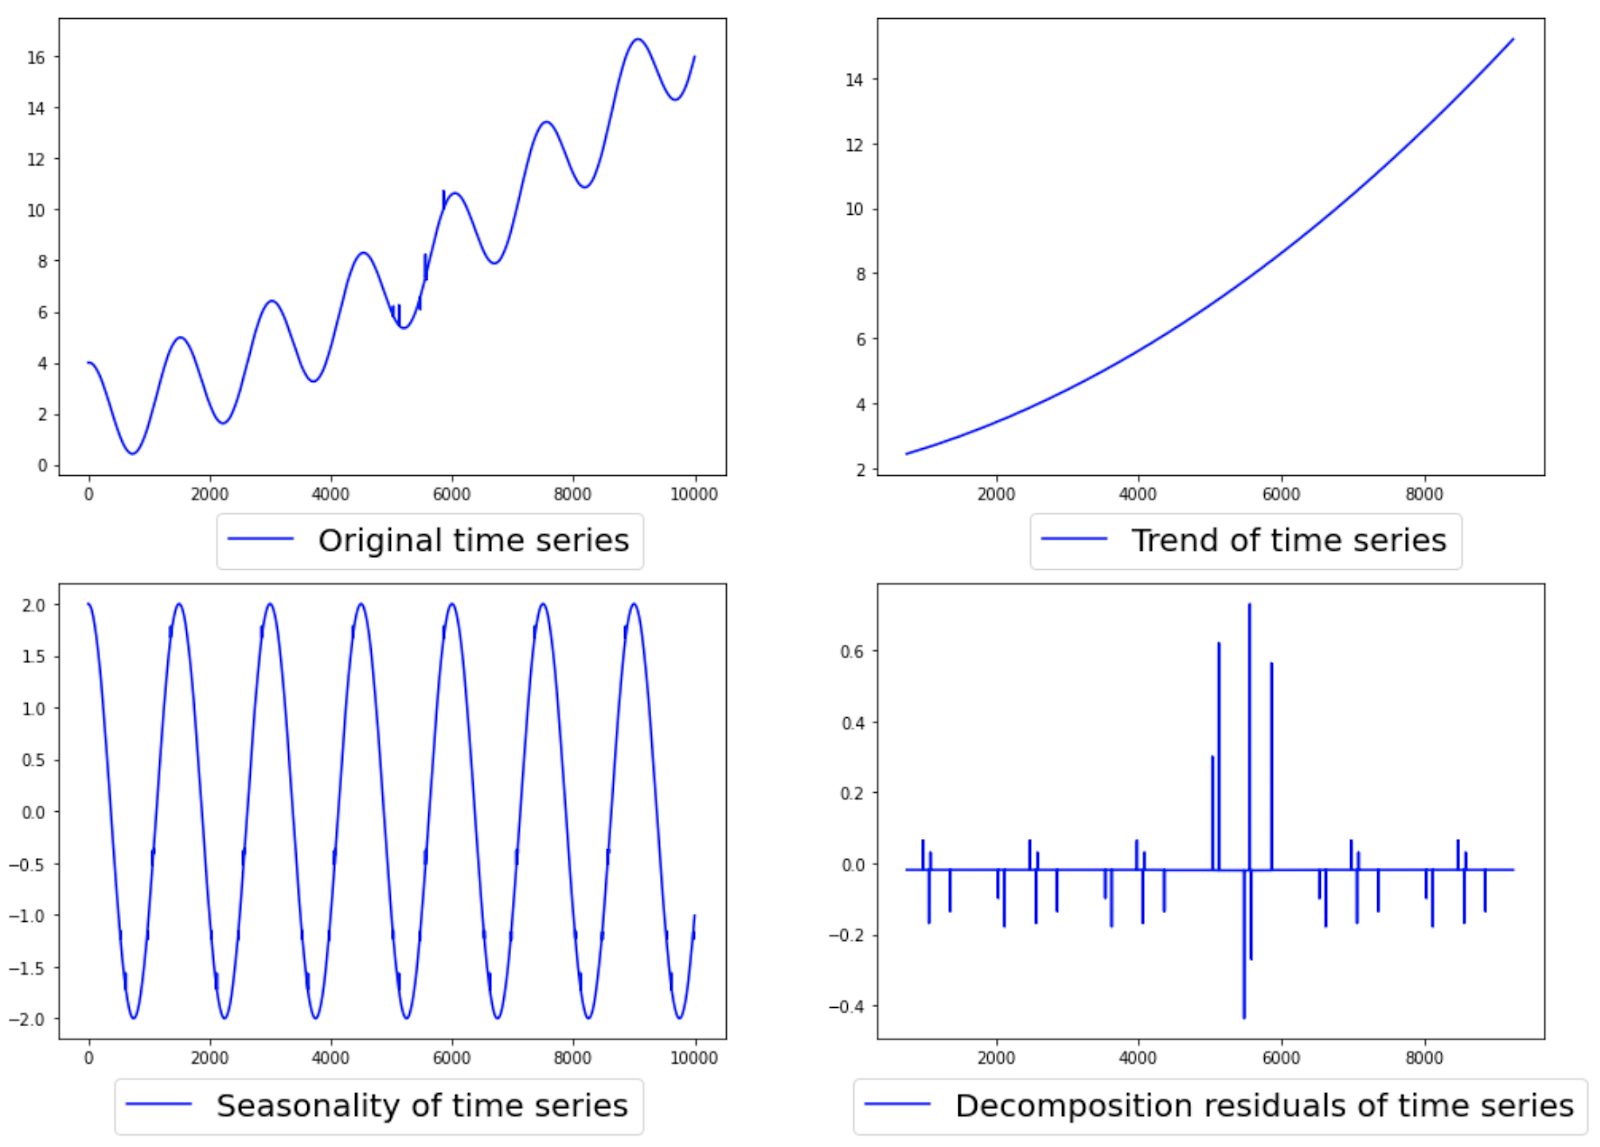
- STL
- Stands for ‘Seasonal-Trend decomposition using Loess’
- Isolates the pattern in time series data, so anything that is left behind is is ‘irregular’ and hence is an anomaly

- Twitter Seasonal Hybrid ESD
- SH-ESD builds on top of ESD (Extreme Studentized Deviate)
- Uses time series decomposition (to extract trends) and statistical tests
- Isolation Forest:
- Based on decision trees
- A decision tree tries to isolate all the data points in the series
- The easier it is to isolate a point, the more likely it is to be an anomaly
- Elliptic Envelope:
- Assumes that the distribution is Gaussian
- Uses covariance estimation to determine anomalies
- Quartile Based Outlier
- A simple method that divides the data into quartiles, and very high or very low values are marked as anomalies
We’ll explore these algorithms and more in further detail in Anomaly Detection for Time Series Data: Part 2